
Introduction
Urbital is a real estate data provider aiming to improve the delivery of real estate services via digital offerings. The main goal is to deliver a digital tool that enables a better experience for homeowners, potential buyers and real estate brokers to access relevant real estate data. The application is accessible via smart phone and informs homeowners of pricing information as well as other services that may appeal to his home and/or neighborhood.
Energy Needs
The market price for a home is determined by factors such as square footage of the home, features and amenities present in an appraisal. Beyond these factors are others, determined by user needs. In Puerto Rico, one of these needs is consistent, reliable utilities services, such as electricity and Internet.
The value of your home, or the investments you will make in a future home purchase are correlated to how often you lose power in your neighborhood.
We at Urbital developed the a component within our app titled “Apagones de Puerto Rico” or, Puerto Rico Blackouts, as the result of an effort that started on September 26, 2021. We have been gathering the data as published by LUMA via an API endpoint that they are using on https://miluma.lumapr.com/outages/outageMap. We have a process that persists this data every hour, allowing us to display how many hours per day a zone in a town is without the energy service.
In total, we have gathered over 8,200 hours of data, or ~342 days. The original purpose of this project was to display energy uptime information for the real-state application Urbital but we have found it useful to release this information to the public on broader terms.
Energy Outage Findings
The following report is an exercise to analyze service interruption reports published by LUMA by comparing and attempting to match the data to a sample of 18 user-reported service interruptions on Twitter.
Two data sources were used for our analysis:
- User-reported service interruptions by Puerto Rico LUMA clients on Twitter. (Figure 1)
- Energy interruption data logs from LUMA Energy via Apagones de Puerto Rico application.
Our intervention began by using Twitter’s search and entering keywords “cond” or “urb”, followed by “luma avería” to pull up user reports about service interruptions in condominiums and urbanizations.
We selected 18 Tweets of interest, from the municipalities of San Juan, Bayamón, Ponce and Trujillo Alto, dating from 2021-2022:

We created a table of the data from our selected Tweets to compare it with Apagones de Puerto Rico’s service interruption data. The users reports on twitter have the following columns:
- URB/COND NAME
- MUNICIPALITY
- DATE (MM/DD/YY)
We created a second table for the Apagones data:
- URB / COND NAME ON APAGONES
- OUTAGE CLOSEST TO TWITTER DATE
- OUTAGE DURATION
We then attempted to find matches between the user reports and the Apagones reports.
Duplicity in referencing specific neighborhoods or condos
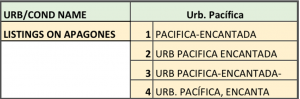
First thing we noted upon beginning the matching exercise, is that LUMA consistently has multiple listings for a unique urbanization or condominium.
We observed that duplicates are caused by the following patterns:
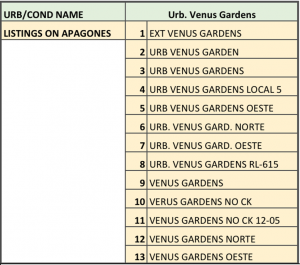
- Inconsistent use of plural ‘s’ character at the end of the name
- Inconsistent use of period marks ‘.’ after Cond or Urb prefixes
- Inconsistent use of ‘Urb’ or ‘Cond’ prefix
- Use of prefix ‘Ext’ (Extension) in place of ‘Urb’
- Abbreviations
- Inconsistent use of Spanish accents
- Use of hyphen signs ‘-‘ in place of spaces
- Use of prefix ‘Apts’ or ‘walk-ups’ in place of ‘Cond’
- Addition of in-house codification un-related to name of the Cond or Urb
- Inconsistent spelling
Due to the observed inconstancies in data-entry and duplicates of unique locations from LUMA’s data, we can conclude preliminarily that the service interruption reports by LUMA are susceptible to inaccuracy.
Crosscheck and comparison
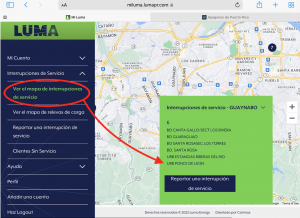
After our discovery of duplicate listings in LUMA’s data, the follow up part of our exercise consisted of pulling up LUMA’s map of current service interruptions on https://miluma.lumapr.com/outages/outageMap and crosschecking the name of the interrupted area and date of interruption against Apagones PR data.
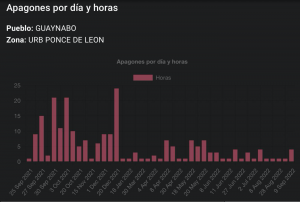
We pulled up the interruptions from the municipality of Guaynabo, on September 10, 2022 (figure 7). We selected at random URB PONCE DE LEON and noticed the same pattern of duplicate listings:
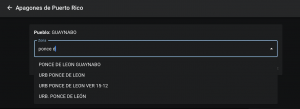
Four duplicate listings come up for URB PONCE DE LEON (figure 8).
We selected the listing spelled exactly as on the map ‘URB PONCE DE LEON’: (figure 9)
The last service interruption was reported September 9th, 2022 for a duration of 4 hours. There is no entry for September 10th. We verified the other 3 listings, none contained outage reports for September 10th.
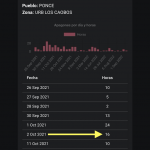
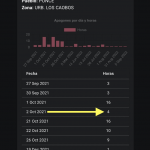
When analyzing the data contained in the duplicate listings, we also observed duplicates which had service interruptions listed for the same day, but with differing interruption duration times. For example, two duplicate listings for Los Caobos Urbanization in Ponce: URB LOS CAOBOS and URB. LOS CAOBOS, both listings report October 2nd service interruptions, but reported differing outage times. (Figure 10)
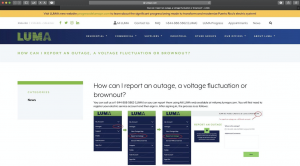
Twitter users reported that “averías” (outages) had been recorded as ‘fixed’ by LUMA, but there remained pockets within the Urbs. without service (figure 11)

Another general conclusion we can make is that there appear to be inconsistencies, and perhaps misstatements, of LUMA’s logged durations of interruptions.
Currently, users can report outages by phoning 1-844-888-5862 or by using Mi LUMA web customer portal miluma.lumapr.com (figure 11). On the web portal, an outage may be reported only at the address linked to the customer’s account.
Neighborhood and urbanization listings contain a group of unique properties, which we are unable to view. We were unable to find details on the neighborhood that our account is associated to. There may be up to four or five references to a cluster of homes.
Questions for LUMA
- How can we facilitate precision and accuracy in user-generated reports?
- What documentation do you provide to consume the miLuma API?
- Do you have other reports or data accessible in machine readable format?
- Do they provide access to the reports they receive from citizens?
- Could you add an ‘API endpoint’ to get the sectors by town and their status (Currently what we have is the result of the historical accumulations, and it really seems that they do manual data entry when there is a blackout).
- Could you provide API endpoints with historical data from a sector in a town?
We’d like to discuss this with LUMA and assist in making the data better!